Linear regression is a supervised learning algorithm used to predict a continuous value based on one or more input features. It finds the best-fitting straight line through the data.
Formula: y = w₁x₁ + w₂x₂ + ... + wₙxₙ + b
y is the predicted valuex₁, x₂, ..., xₙ are input featuresw₁, w₂, ..., wₙ are weights learned during trainingb is the bias (intercept)A Python script that:
import numpy as np
import matplotlib.pyplot as plt
from sklearn.linear_model import LinearRegression
from sklearn.metrics import mean_squared_error
# Generate synthetic data
X = np.random.rand(100, 1) * 10 # Feature: 0–10
y = 2.5 * X + np.random.randn(100, 1) * 2 # Label with noise
# Train model
model = LinearRegression()
model.fit(X, y)
# Predict
y_pred = model.predict(X)
# Evaluate
mse = mean_squared_error(y, y_pred)
print(f"Mean Squared Error: {mse:.2f}")
# Visualize
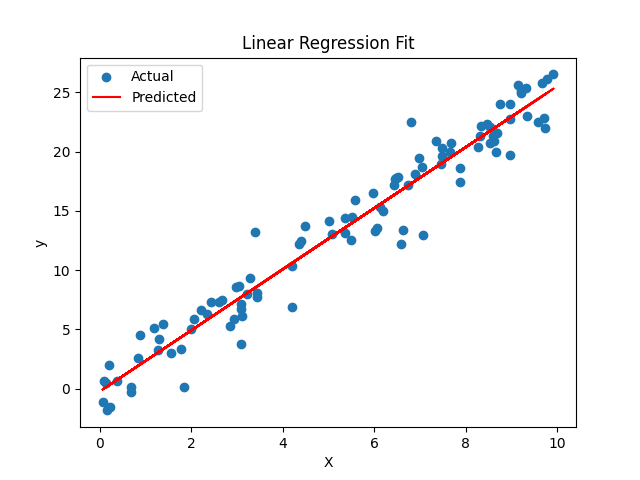
plt.scatter(X, y, label="Actual")
plt.plot(X, y_pred, color="red", label="Predicted")
plt.xlabel("X")
plt.ylabel("y")
plt.title("Linear Regression Fit")
plt.legend()
plt.show()This is the result of the linear regression model plotted against the actual data: