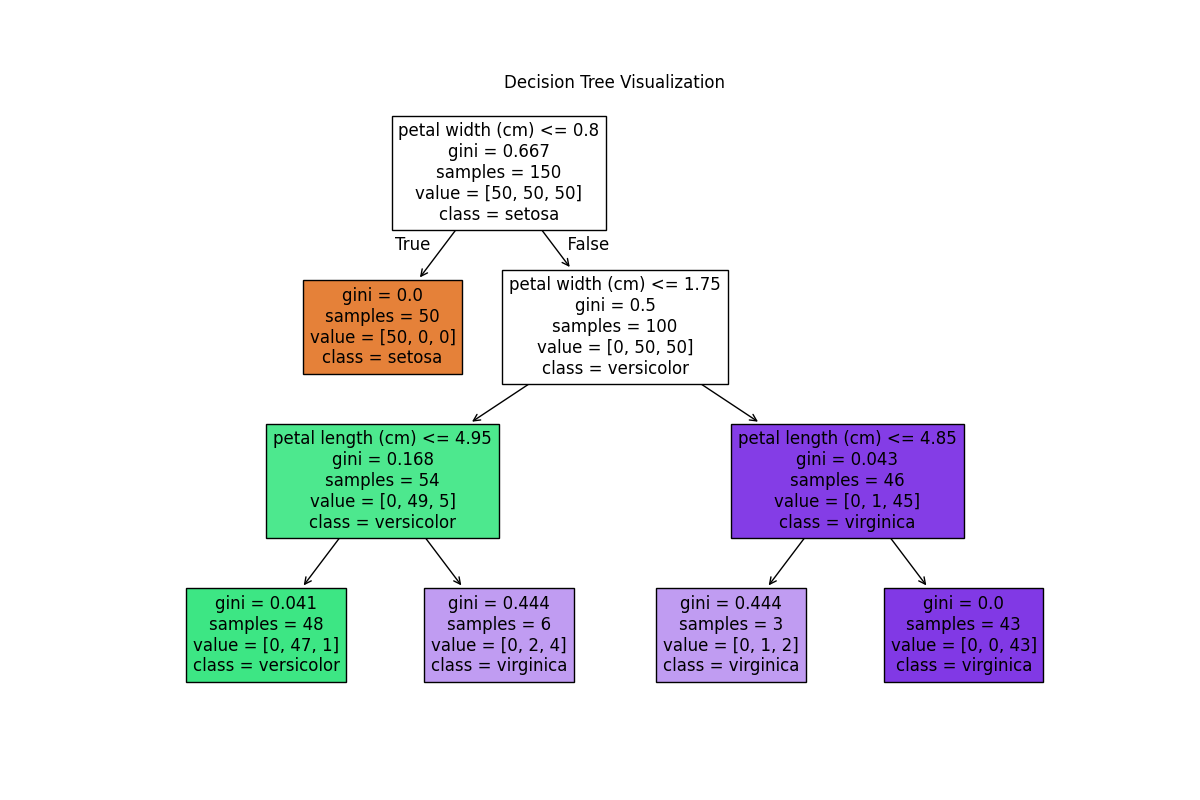
A decision tree is a supervised learning algorithm used for both classification and regression. It splits data into branches based on feature values, like a flowchart of decisions.
A Python script that:
from sklearn.datasets import load_iris
from sklearn.tree import DecisionTreeClassifier, plot_tree
from sklearn.metrics import accuracy_score
import matplotlib.pyplot as plt

# Load dataset
iris = load_iris()
X, y = iris.data, iris.target

# Train model
model = DecisionTreeClassifier(max_depth=3)
model.fit(X, y)

# Predict
y_pred = model.predict(X)

# Evaluate
accuracy = accuracy_score(y, y_pred)
print(f"Accuracy: {accuracy:.2f}")

# Visualize
plt.figure(figsize=(12, 8))
plot_tree(model, feature_names=iris.feature_names, class_names=iris.target_names, filled=True)
plt.title("Decision Tree Visualization")
plt.show()This is where you can display the decision tree plot generated by your script:
